Monthly Housing Update
A comprehensive overview of monthly property sales activity for the Greater Houston area as recorded in the MLS.
Multiple Listing Service of the Houston Association of REALTORS® includes residential properties and new homes listed by 50,000 REALTORS®
HOUSTON HOME SALES OUTPERFORM IN NOVEMBER
Sales register their first increase in 19 months amid expanding inventory and moderating prices
HOUSTON — (December 13, 2023) — Just in time for the holidays, the Houston real estate market received a gift in November in the form of positive sales for the first time in 19 months. There are even more healthy indicators layered throughout the latest housing market report as 2023 draws to a close.
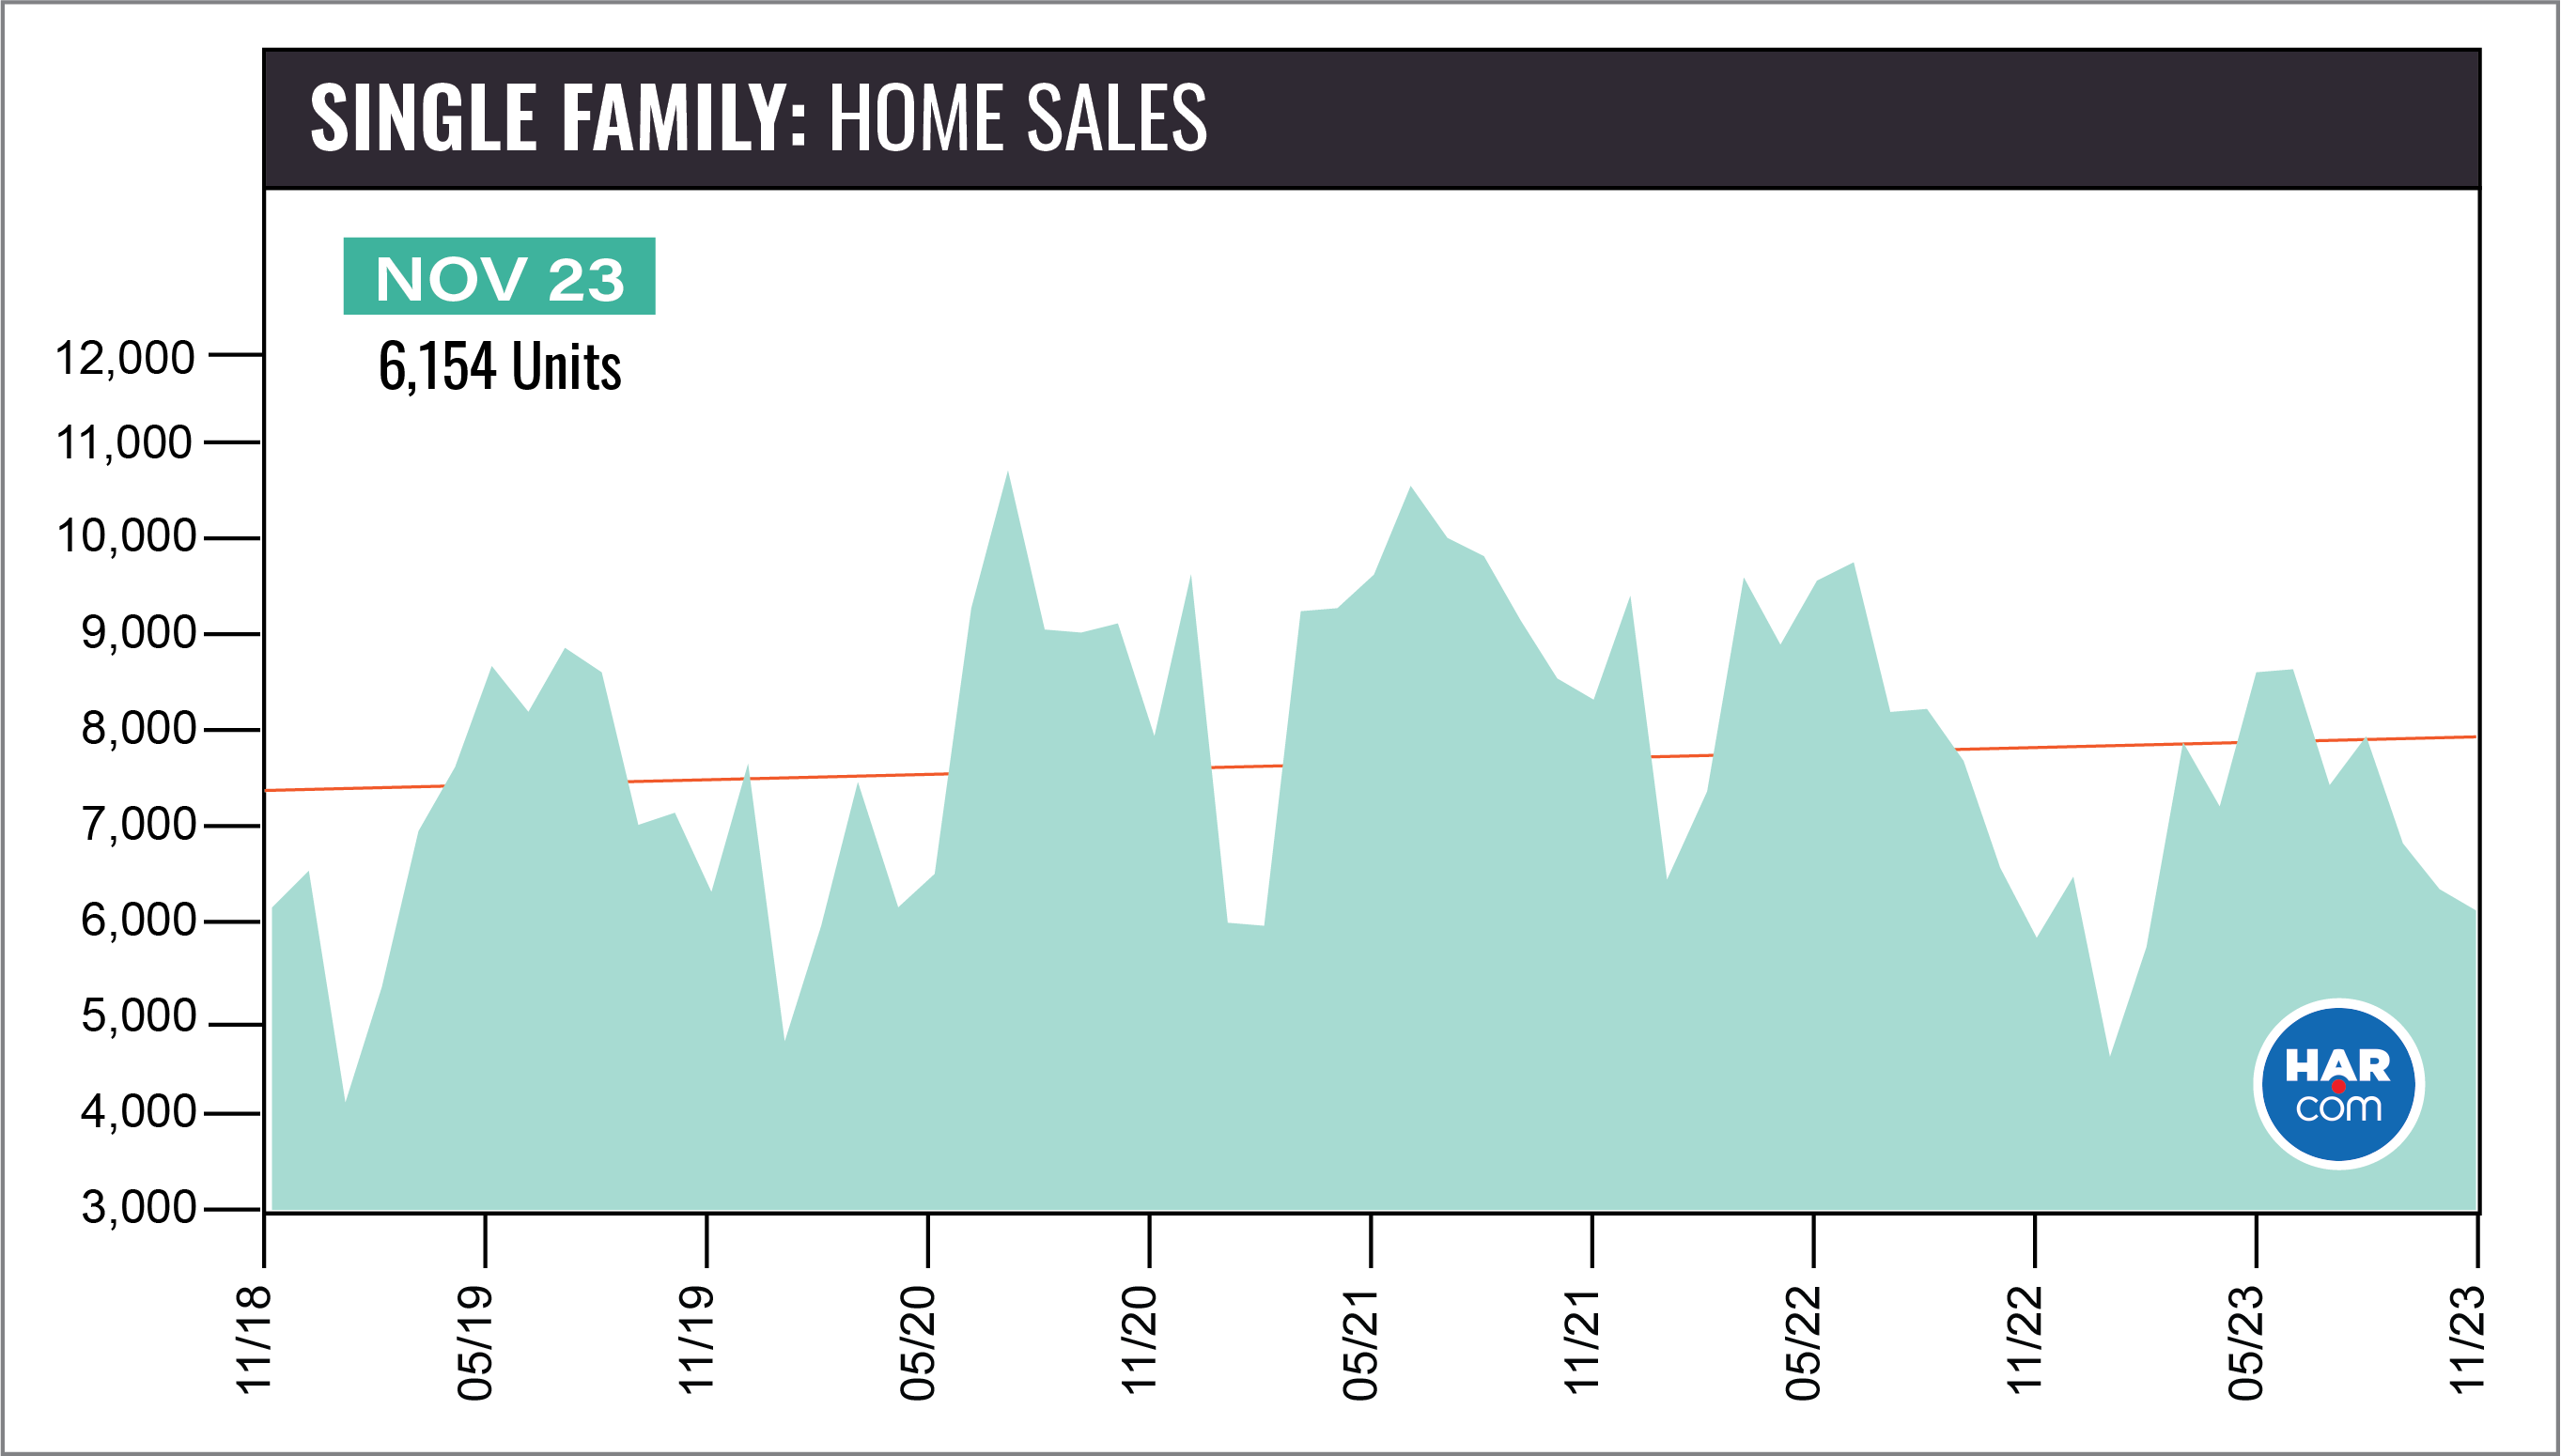
According to the Houston Association of Realtors’ (HAR) November 2023 Market Update, single-family home sales across Greater Houston rose 4.9 percent, the first increase since March 2022. The Houston Multiple Listing Service (MLS) recorded sales of 6,154 units compared to 5,864 in November 2022. Months supply of homes climbed from 2.8 to 3.5. Compared to pre-pandemic November 2019, when volume totaled 6,359, home sales were down 3.2 percent.
Only homes priced below $150,000 saw declines during the month. That segment comprises just 3.5 percent of the overall market. The best performing segment consisted of homes priced between $250,000 and $500,000, which rose 8.0 percent year-over-year. That segment is the largest, comprising 59.8 percent of the market. Rentals of single-family homes and townhomes/condominiums registered another strong month. HAR will publish its November 2023 Rental Home Update next Wednesday, December 20.
“I couldn’t think of a better way to wrap up 2023 than to see positive sales trends after nearly two years of negative trending,” said HAR Chair Cathy Treviño with LPT, Realty. “Home sales hinge heavily on interest rates, so hopefully consumer confidence will be restored as we begin the new year, especially since inventory has steadily improved and prices have moderated, creating more favorable conditions for buyers.”
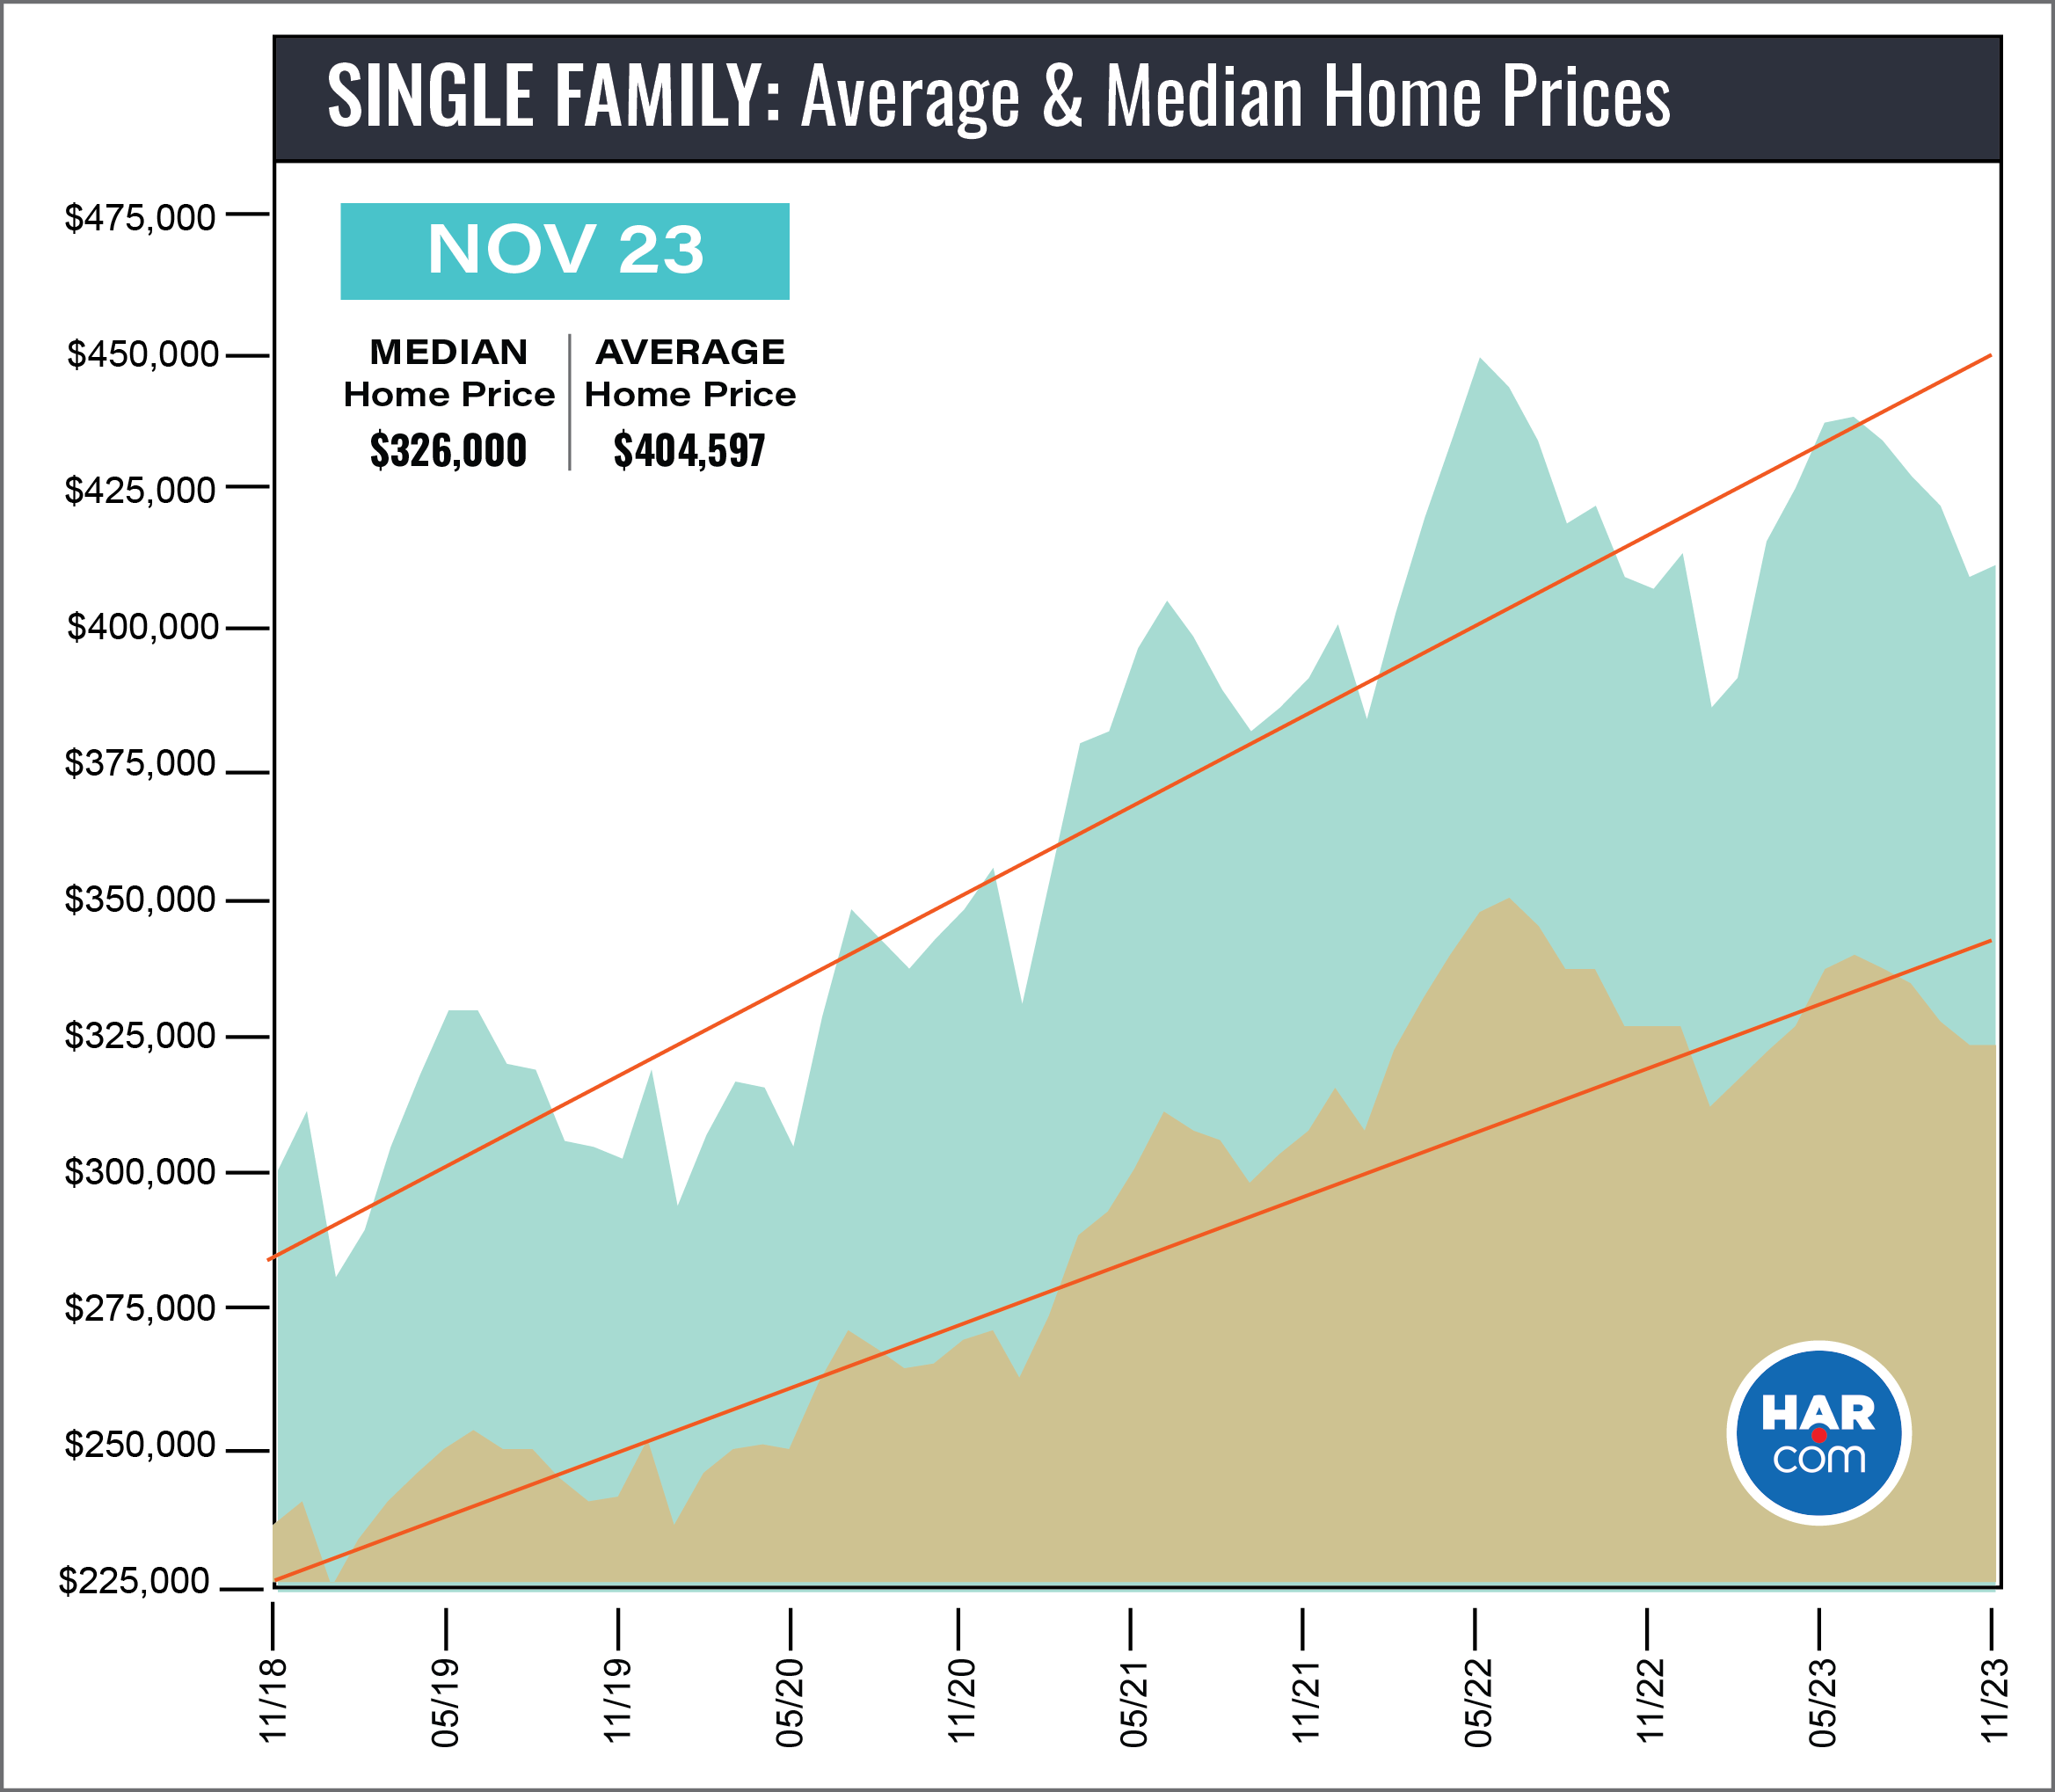
The average price of a single-family home throughout Greater Houston edged up 1.0 percent to $404,597 while the median price notched downward 1.2 percent to $326,000. Those figures are well below the record highs of $438,350 (average) in May 2022 and $354,000 (median) in June 2022.
November Monthly Market Comparison
November marked the first time in 19 months that single-family homes sales were in positive territory with sales rising 4.9 percent year-over-year. When compared to pre-pandemic November 2019, sales were down 3.2 percent and when stacked up against the sales volume in November 2018, five years ago, sales were statistically flat.
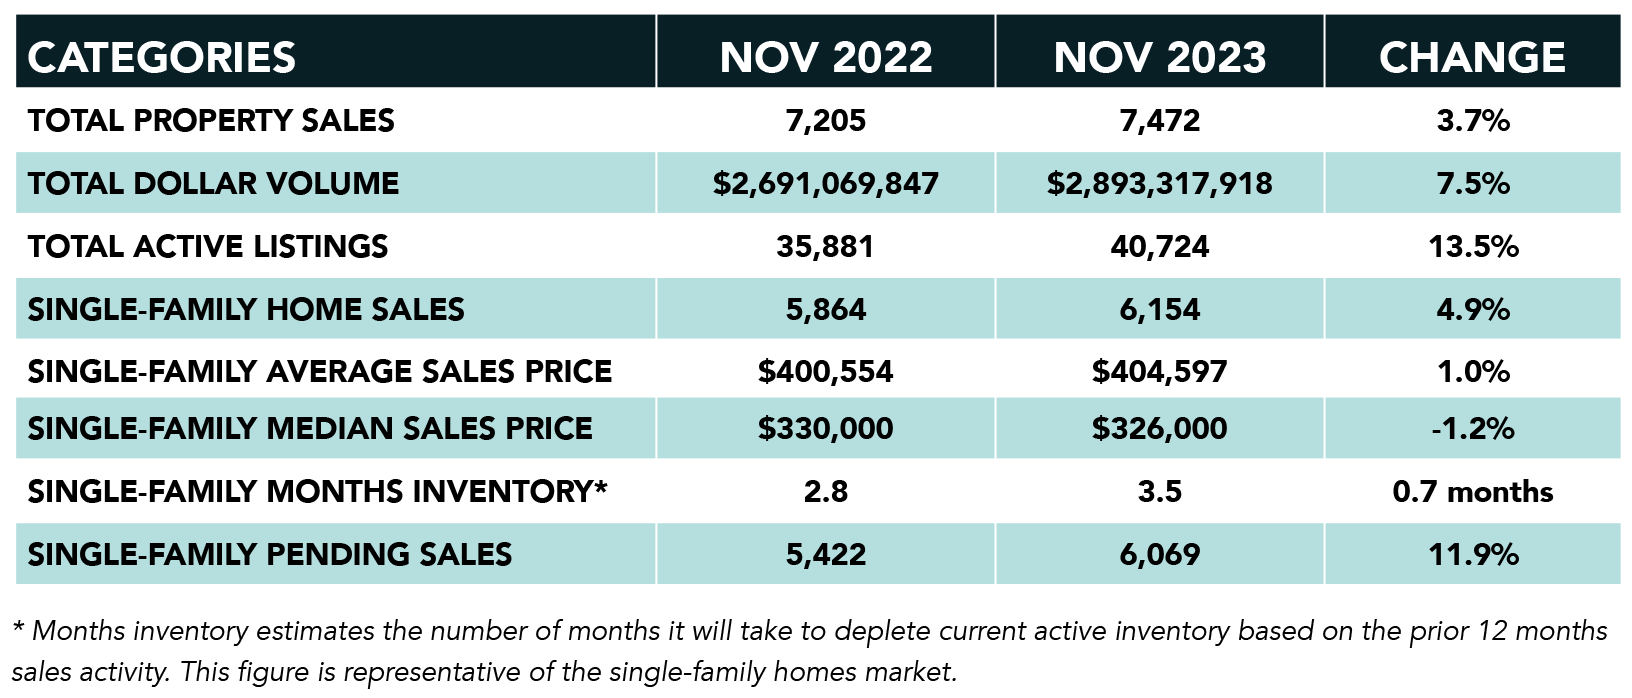
In addition to the increase in single-family sales volume, total property sales rose 3.7 percent and total dollar volume climbed 7.5 percent from $2.7 billion to $2.9 billion. Single-family pending sales rose 11.9 percent. Active listings, or the total number of available properties, were 13.5 percent ahead of the 2022 level.
Months of inventory expanded from a 2.8-months supply last November to 3.5 months, matching its October 2023 level. It is the greatest supply of homes since November 2019. Housing inventory nationally is at a 3.6-months supply, according to the latest report from the National Association of Realtors (NAR). A 4.0- to 6.0-month supply is generally considered a “balanced market” in which neither buyer nor seller has an advantage.
Single-Family Homes Update
In November, single-family home sales experienced the first increase in 19 months, climbing 4.9 percent year-over-year with a total of 6,154 units sold across the Greater Houston area versus 5,864 in 2022. Pricing continues to moderate after spiking in the spring of 2022. The average price rose 1.0 percent to $404,597 while the median price fell 1.2 percent to $326,000.
For a pre-pandemic perspective, November closings were 3.2 percent below the November 2019 total of 6,359. The November 2023 median price of $326,000 is 35.3 percent above its 2019 level ($241,000), and today’s average price of $404,597 is 36.2 percent higher than it was back then ($297,070). Sales are statistically unchanged from where they were five years ago, in November 2018, when volume totaled 6,170. Back then, the median price was $235,000 and the average price was $294,583.
Days on Market, or the actual time it took to sell a home, eased slightly from 48 to 47 days. Months of inventory registered a 3.5-months supply for the second consecutive month and compares to 2.8 months a year earlier. That is the greatest months supply in four years. The current national supply stands at 3.6 months, as reported by NAR.
Broken out by housing segment, November sales performed as follows:
- $1 - $99,999: decreased 19.4 percent
- $100,000 - $149,999: decreased 9.4 percent
- $150,000 - $249,999: increased 3.6 percent
- $250,000 - $499,999: increased 8.0 percent
- $500,000 - $999,999: increased 4.1 percent
- $1M and above: increased 4.1 percent
HAR also breaks out sales figures for existing single-family homes. Existing home sales totaled 3,958 in November, down 4.4 percent from the same month last year. The average price rose 3.7 percent to $409,934 and the median sales price rose 3.2 percent to $320,000.
For HAR’s Monthly Activity Snapshot (MAS) of the November 2023 trends, please click HERE to access a downloadable PDF file.
Townhouse/Condominium Update
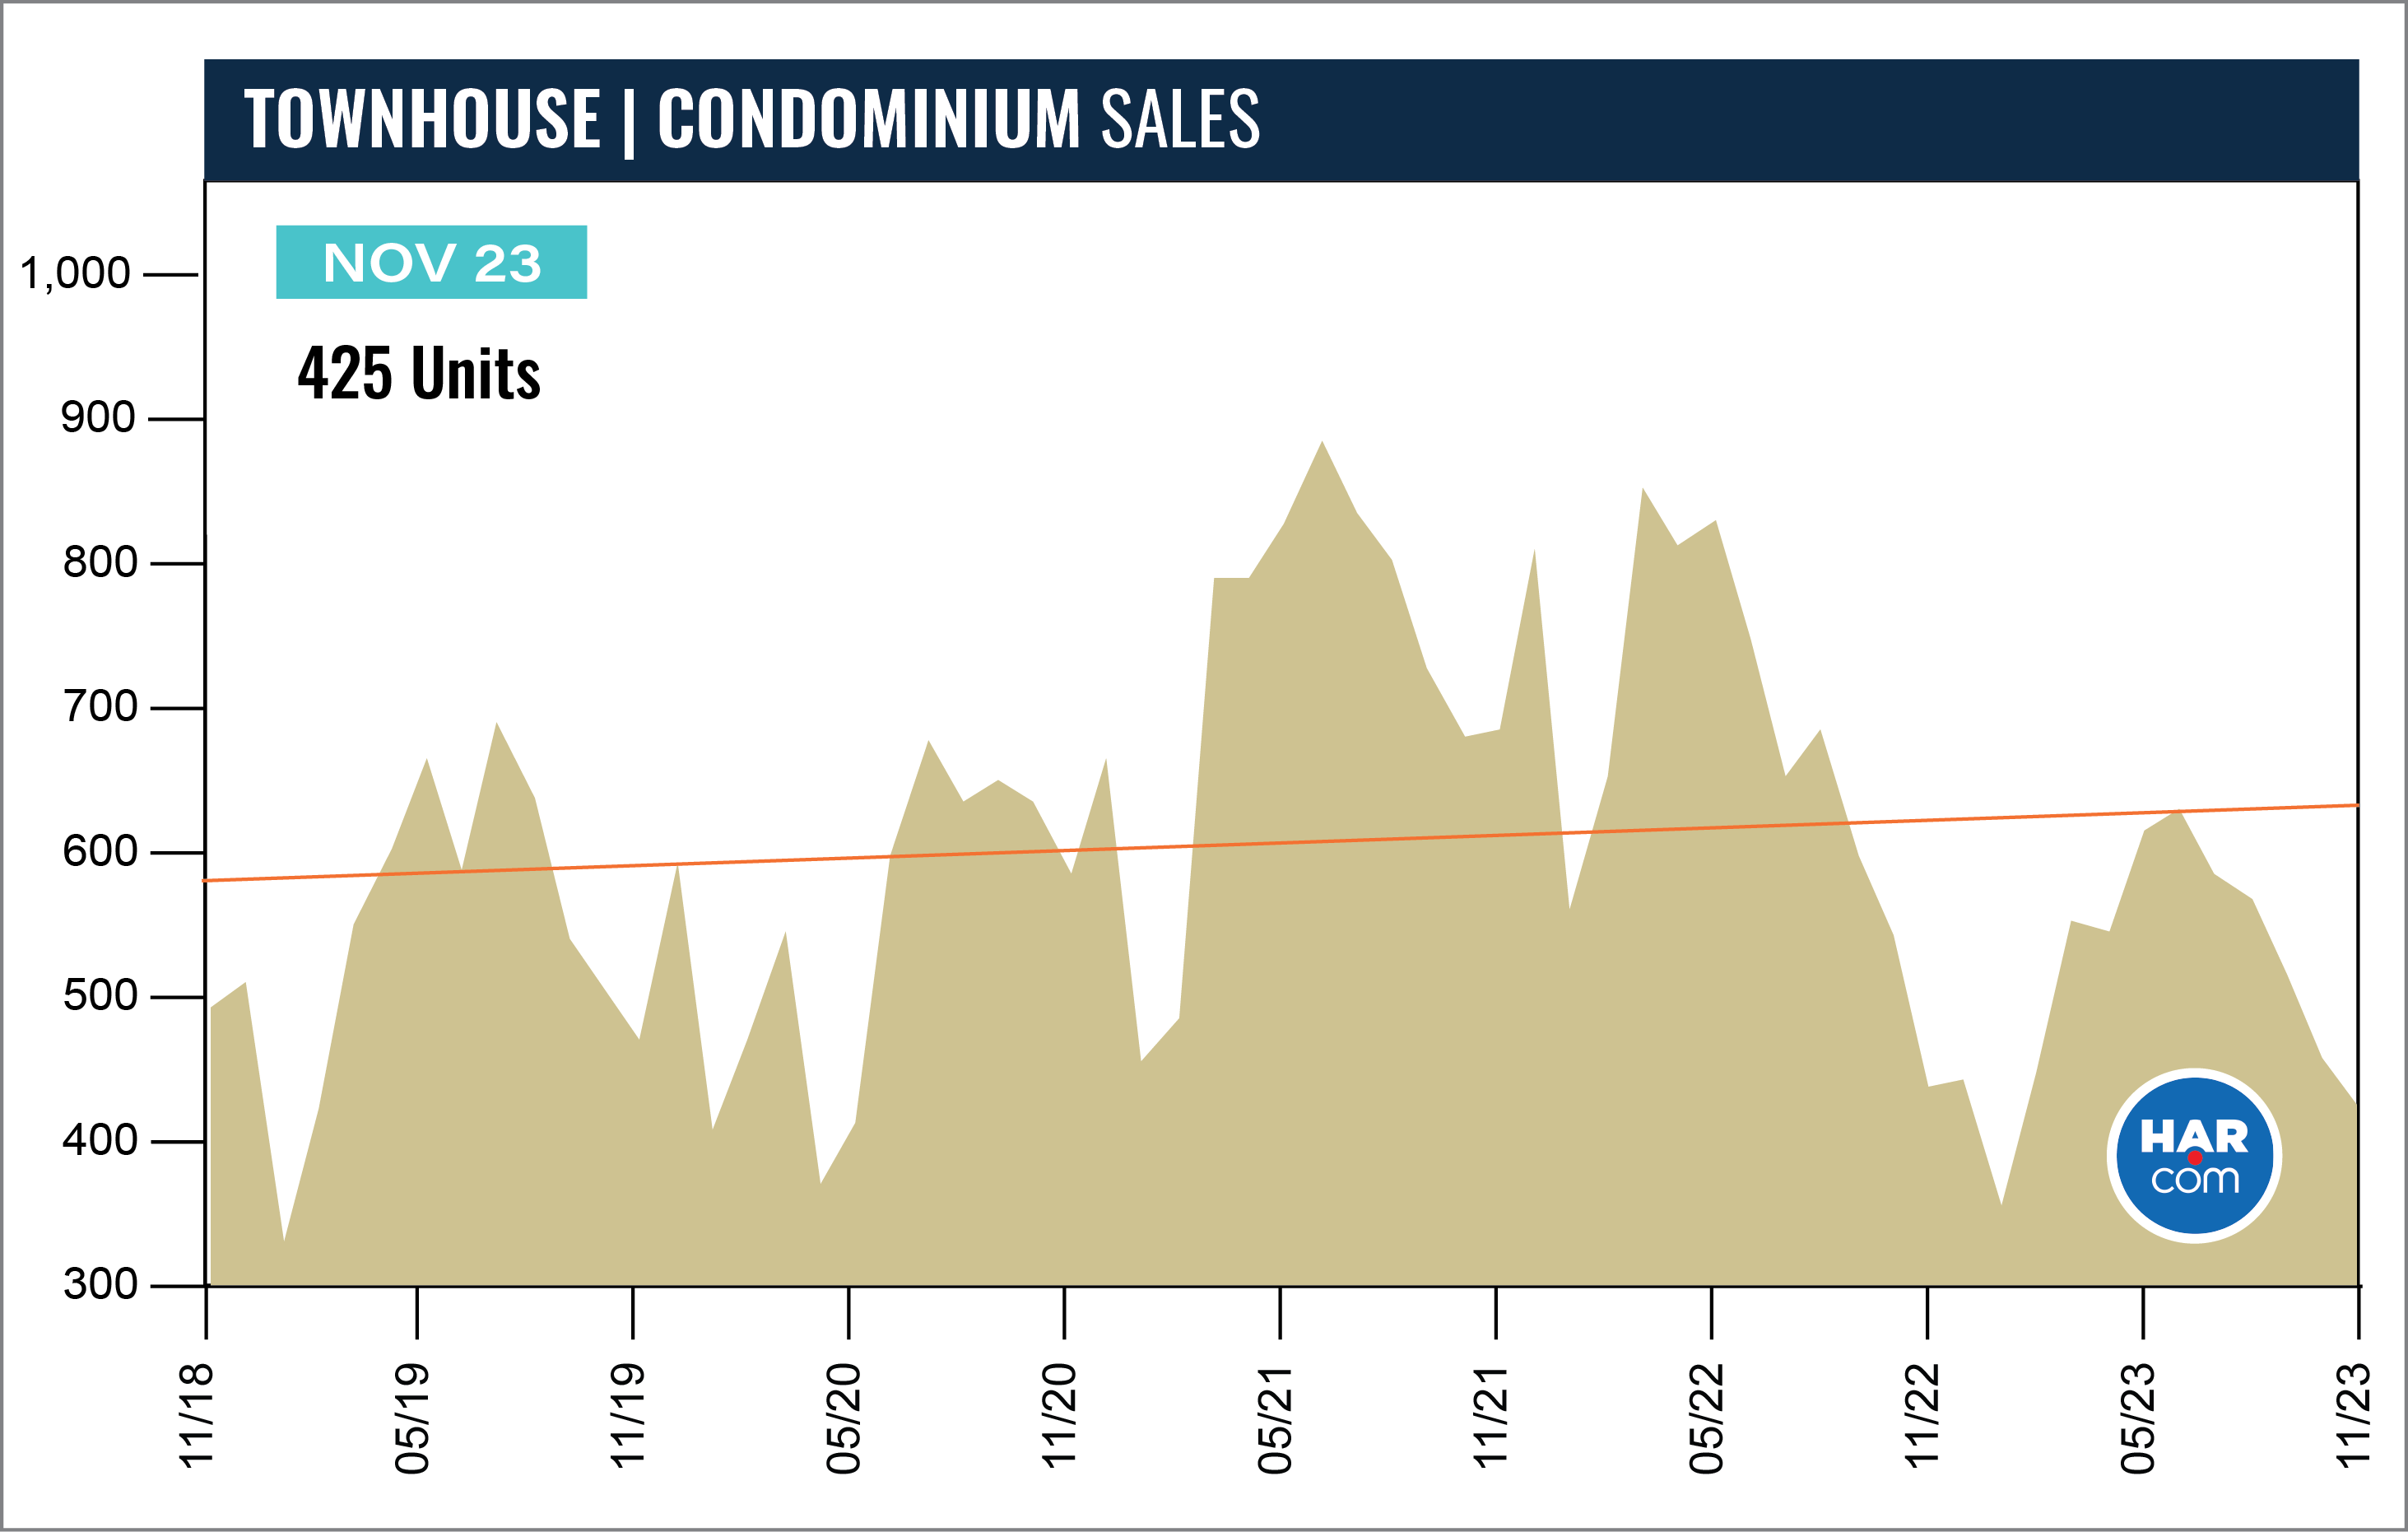
November did not bring a rebound to the townhouse and condominium market, which experienced its 18th consecutive monthly decline. Sales volume fell 3.0 percent year-over-year with 425 closed sales versus 438 a year earlier. However, that is the smallest rate of decline since the slump began in June 2022, which might suggest that a rebound is in the offing.
The average price of townhomes and condominiums rose 7.3 percent to $272,382 and the median price jumped 11.4 percent to $245,000. Inventory grew from a 2.1-months supply to 3.7 months, the highest level since November 2020.
Compared to pre-pandemic November 2019, when 470 units sold, townhome and condominium sales were down 9.6 percent. The average price back then was $218,618 and the median price was $170,000.
Houston Real Estate Highlights in November
- Single-family home sales rose 4.9 percent year-over-year, the first increase in 19 months;
- Compared to November 2019, before the pandemic, sales were down 3.2 percent, and compared to November 2018, five years back, they were statistically flat;
- Days on Market (DOM) for single-family homes went from 48 to 47 days;
- Total property sales rose 3.7 percent with 7,472 units sold;
- Total dollar volume was up 7.5 percent to $2.9 billion;
- The single-family median price fell 1.2 percent to $326,000;
- The single-family average price rose 1.0 percent to $404,597;
- Single-family home months of inventory registered a 3.5-months supply, up from 2.8 months a year earlier – the highest level since November 2019;
- Townhome/condominium sales experienced their 18th straight monthly decline, falling 3.0 percent, with the median price up 11.4 percent to $245,000 and the average price up 7.3 percent to $272,382;
- Compared to pre-pandemic 2019, townhome and condominium sales were down 9.6 percent.

